Market Outlook
September 29, 2016
Market Cues
Domestic Indices
Chg (%)
(Pts)
(Close)
Indian markets are likely to open on a positive note considering global cues.
BSE Sensex
0.2
69
28,293
Nifty
0.4
39
8,745
The U.S. markets swung higher Wednesday after OPEC member countries reached
Mid Cap
0.9
121
13,397
a consensus to limit crude production and is considering cutting production to
between 32.5 million to 33 million barrels a day. The S&P 500 index rose 0.5%
Small Cap
1.0
135
13,039
while Dow Jones Industrial Average rose 0.6%, led by a 4.3% surge in the energy
Bankex
0.7
164
22,456
sector. The rally in crude is one of the driving forces, along with the bounce in
Deutsche Bank. Despite the initial euphoria over OPEC’s move to tackle the supply
Global Indices
Chg (%)
(Pts)
(Close)
glut, some analysts questioned how effective the measure will be given that the
production cap exceeds OPEC’s average of about 30 million barrels a day.
Dow Jones
0.6
111
18,339
Nasdaq
0.2
13
5,319
After shaky start to the week, FTSE
100 rebounded, buoyed by a bounce in
commodity-related stocks. The UK Index climbed 0.61%, due to sharp gains in the
FTSE
0.6
42
6,849
mining stocks such as Rio Tinto, BHP Billiton, Anglo American and Antofagasta. The
Nikkei
(1.3)
(219)
16,465
boost came as nickel prices neared seven-month highs after the Philippines said to
Hang Seng
0.2
48
23,620
suspend 20 more mines.
Shanghai Com
(0.3)
(10)
2,988
After a flat opening, Indian markets staged recovery in noon trades and closed
higher on renewed buying interest in blue chips particularly financials and auto.
Advances / Declines
BSE
NSE
Recovery in European shares further bolstered trading sentiment during mid-session.
Meanwhile, investors are keenly awaiting for the expiry of the September F&O series
Advances
1,649
1,037
and roll over positions to the October series due tomorrow.
Declines
1,014
583
News Analysis
Unchanged
229
79
Reliance Power to double capacity of thermal plants in UP and Maharashtra
Cipla aims to reach $1bn India sales through tie-ups
Volumes (` Cr)
Detailed analysis on Pg2
BSE
2,933
Investor’s Ready Reckoner
NSE
21,604
Key Domestic & Global Indicators
Net Inflows (` Cr)
Net
Mtd
Ytd
Stock Watch: Latest investment recommendations on 150+ stocks
Refer Pg5 onwards
FII
(144)
4,329
44,997
MFs
191
1,357
11,466s
Top Picks
CMP
Target
Upside
Company
Sector
Rating
(`)
(`)
(%)
Top Gainers
Price (`)
Chg (%)
Amara Raja Batteries Auto & Auto Ancillary Accumulate
1,026
1,174
14.4
Network18
49
12.9
HCL Tech
IT
Buy
796
1,000
25.7
Indianb
229
10.8
Bharat Electronics
Capital Goods
Accumulate
1,281
1,414
10.4
Idfc
68
7.3
Equitas Holdings
Financials
Buy
177
235
32.5
Mrf
49,734
6.7
Navkar Corporation Others
Buy
189
265
40.4
More Top Picks on Pg3
Jktyre
148
6.2
Key Upcoming Events
Previous
Consensus
Top Losers
Price (`)
Chg (%)
Date
Region
Event Description
Reading
Expectations
Mphasis
521
(3.3)
Sep 29 US
Initial Jobless claims
252.0
260.0
Bajajelec
264
(3.1)
Sep 29 US
GDP QoQ (Annualised)
1.1
1.3
Piind
810
(2.6)
Sep 29 Germany
Unemployment Change (000s)
(7.0)
(5.0)
Sep 29 Euro Zone
Euro Zone Consumer Confidence
(8.2)
(8.2)
Shriramcit
2,184
(2.3)
Sep 30 UK
GDP (YoY)
2.2
2.2
Muthootfin
365
(2.1)
Oct 01 UK
PMI Manufacturing
53.3
--
As on September 28, 2016
Oct 03 China
PMI Manufacturing
50.4
50.4
6.(
More Events on Pg4
Market Outlook
September 29, 2016
News Analysis
Reliance Power to double capacity of thermal plants in UP and
Maharashtra
Reliance Power will double capacity of Rosa power plant in Uttar Pradesh to 2,400
MW and Butibori power plant in Maharashtra to 1,200 MW. The company will
also set up a solar PV plant of up to 400 MW capacity in coming years, and will
look at future opportunities with caution.
The company has completed phase I of its `50,000cr capex and currently has an
operating capacity of 6 GW. Company is also engaged in talks with Andhra
Pradesh for a mutual consent to abandon its UMPP in the state to reduce its capex
by
`20,000cr. Company wants to replicate its success at Tilayia UMPP in
Jharkhand which reduced its capex by
`36,000cr. Reliance Power stopped
developing Krishnapatnam UMPP after imported coal prices shot up in FY13. The
company had bagged three UMPPs, of which it is operating the pithead-based
Sasan UMPP in Madhya Pradesh. Reliance Power has signed an MoU with
Bangladesh government for setting up a 3,000 MW gas-based power project.
Company's revenue rose 53 % in FY16 while EBITDA was up 87 %, and PAT was
up 32 %.
Cipla aims to reach $1bn India sales through tie-ups
Cipla, is setting its eyes on reaching a billion dollar sales mark, backed by new
drug launches from its own research labs and a slew of partnerships with
multinational and Indian drug firms. The MD of Cipla, told that he hoped the India
sales to cross a billion dollar relatively soon.
Cipla has stepped up launch plans in areas like respiratory, dermatology,
cardiovascular and urology, which will help speed up its India growth. Also,
several Indian and multinational drug makers have shown interest in partnering
for launch of several products in India hence company is expecting strong of
13-15% growth in India led by 8-10% growth in volumes.
In 2014, Cipla partnered with Merck to sell its HIV drug brand, Isentress, under a
different brand name. The same year, Cipla signed a licensing agreement with
Gilead, alongside a bunch of other Indian companies, to market Hepatitis C drug
sofosbuvir.
Economic and Political News
India's sugar output to decline 7% in 2016-17
Cabinet clears `2,256cr project Saksham for GST integration
Govt likely to provide benefits to jute industry
Corporate News
ING Group NV to sell stake in Kotak Mahindra Bank via block deal
Delta Corp may buy rummy website ace2three.com for $80-100 million
Airtel makes incoming calls on international roaming free, slashes data rates on
some plans
Market Outlook
September 29, 2016
Top Picks ★★★★★
Large Cap
Market Cap
CMP
Target
Upside
Company
Rationale
(` Cr)
(`)
(`)
(%)
To outpace battery industry growth due to better technological
Amara Raja Batteries
17,533
1,026
1,174
14.4
products leading to market share gains in both the
automotive OEM and replacement segments.
Uptick in defense capex by government when coupled with
Bharat Electronics
30,743
1,281
1,414
10.4
BELs strong market positioning, indicate that good times are
ahead for BEL.
The stock is trading at attractive valuations and is factoring all
HCL Tech
1,12,233
796
1,000
25.7
the bad news.
Back on the growth trend, expect a long term growth of 14%
Infosys
2,38,561
1,039
1,370
31.9
to be a US$20bn in FY2020.
Source: Company, Angel Research
Mid Cap
Market Cap
CMP
Target
Upside
Company
Rationale
(` Cr)
(`)
(`)
(%)
Among the top 4 players in the consumer durables segment.
Bajaj Electricals
2,667
264
306
16.0
Improved profitability backed by turn around in E&P
segment. Strong order book lends earnings visibility.
Favourable outlook for the AC industry to augur well for
Cooling products business which is out pacing the market
Blue Star
5,232
549
578
5.3
growth. EMPPAC division's profitability to improve once
operating environment turns around.
With a focus on the low and medium income (LMI) consumer
Dewan Housing Finance
8,704
298
325
9.0
segment, the company has increased its presence in tier-II &
III cities where the growth opportunity is immense.
Strong loan growth backed by diversified loan portfolio and
adequate CAR. ROE & ROA likely to remain decent as risk of
Equitas Holdings
5,950
177
235
32.5
dilution remains low. Attractive valuations considering
growth.
Economic recovery to have favourable impact on advertising
& circulation revenue growth. Further, the acquisition of a
Jagran Prakashan
6,218
190
225
18.3
radio business (Radio City) would also boost the company's
revenue growth.
Speedier execution and speedier sales, strong revenue
Mahindra Lifespace
1,835
447
522
16.7
visibilty in short-to-long run, attractive valuations
Massive capacity expansion along with rail advantage at ICD
Navkar Corporation
2,692
189
265
40.4
as well CFS augurs well for the company
Strong brands and distribution network would boost growth
Siyaram Silk Mills
1,219
1,300
1,469
13.0
going ahead. Stock currently trades at an inexpensive
valuation.
Market leadership in Hindi news genre and no. 2 viewership
ranking in English news genre, exit from the radio business,
TV Today Network
1,804
302
363
20.0
and anticipated growth in ad spends by corporates to benefit
the stock.
Source: Company, Angel Research
Market Outlook
September 29, 2016
Key Upcoming Events
Global economic events release calendar
Date
Time
Country
Event Description
Unit
Period
Bloomberg Data
Last Reported Estimated
Sep 29, 2016
6:00PM
US
Initial Jobless claims
Thousands
Sep 24
252.00
260.00
2:30PM
Euro Zone
Euro-Zone Consumer Confidence
Value
Sep F
(8.20)
(8.20)
6:00PM
US
GDP Qoq (Annualised)
% Change
2Q T
1.10
1.30
1:25PM
Germany
Unemployment change (000's)
Thousands
Sep
(7.00)
(5.00)
Sep 30, 2016
2:00PM
UK
GDP (YoY)
% Change
2Q F
2.20
2.20
Oct 1, 2016
2:00PM
UK
PMI Manufacturing
Value
Sep
53.30
--
Oct 3, 2016
6:30AM
China
PMI Manufacturing
Value
Sep
50.40
50.40
1:25PM
Germany
PMI Manufacturing
Value
Sep F
54.30
--
Oct 4, 2016
11:00AM
India
RBI Reverse Repo rate
%
Oct 4
6.00
--
11:00AM
India
RBI Repo rate
%
Oct 4
6.50
--
11:00AM
India
RBI Cash Reserve ratio
%
Oct 4
4.00
--
Oct 5, 2016
1:25PM
Germany
PMI Services
Value
Sep F
50.60
--
Oct 7, 2016
2:00PM
UK
Industrial Production (YoY)
% Change
Aug
2.10
--
6:00PM
US
Change in Nonfarm payrolls
Thousands
Sep
151.00
175.00
6:00PM
US
Unnemployment rate
%
Sep
4.90
4.90
Oct 10, 2016
India
Imports YoY%
% Change
Sep
(14.09)
--
India
Exports YoY%
% Change
Sep
(0.30)
--
Oct 12, 2016
China
Exports YoY%
% Change
Sep
(2.80)
--
Oct 13, 2016
5:30PM
India
Industrial Production YoY
% Change
Aug
(2.40)
--
Oct 14, 2016
US
Producer Price Index (mom)
% Change
Sep
(0.30)
--
12:00PM
India
Monthly Wholesale Prices YoY%
% Change
Sep
3.74
--
7:00AM
China
Consumer Price Index (YoY)
% Change
Sep
1.30
--
Oct 17, 2016
2:30PM
Euro Zone
Euro-Zone CPI (YoY)
%
Sep F
0.20
--
6:45PM
US
Industrial Production
%
Sep
(0.43)
--
Oct 18, 2016
6:00PM
US
Consumer price index (mom)
% Change
Sep
0.20
--
2:00PM
UK
CPI (YoY)
% Change
Sep
0.60
--
Source: Bloomberg, Angel Research
Market Outlook
September 29, 2016
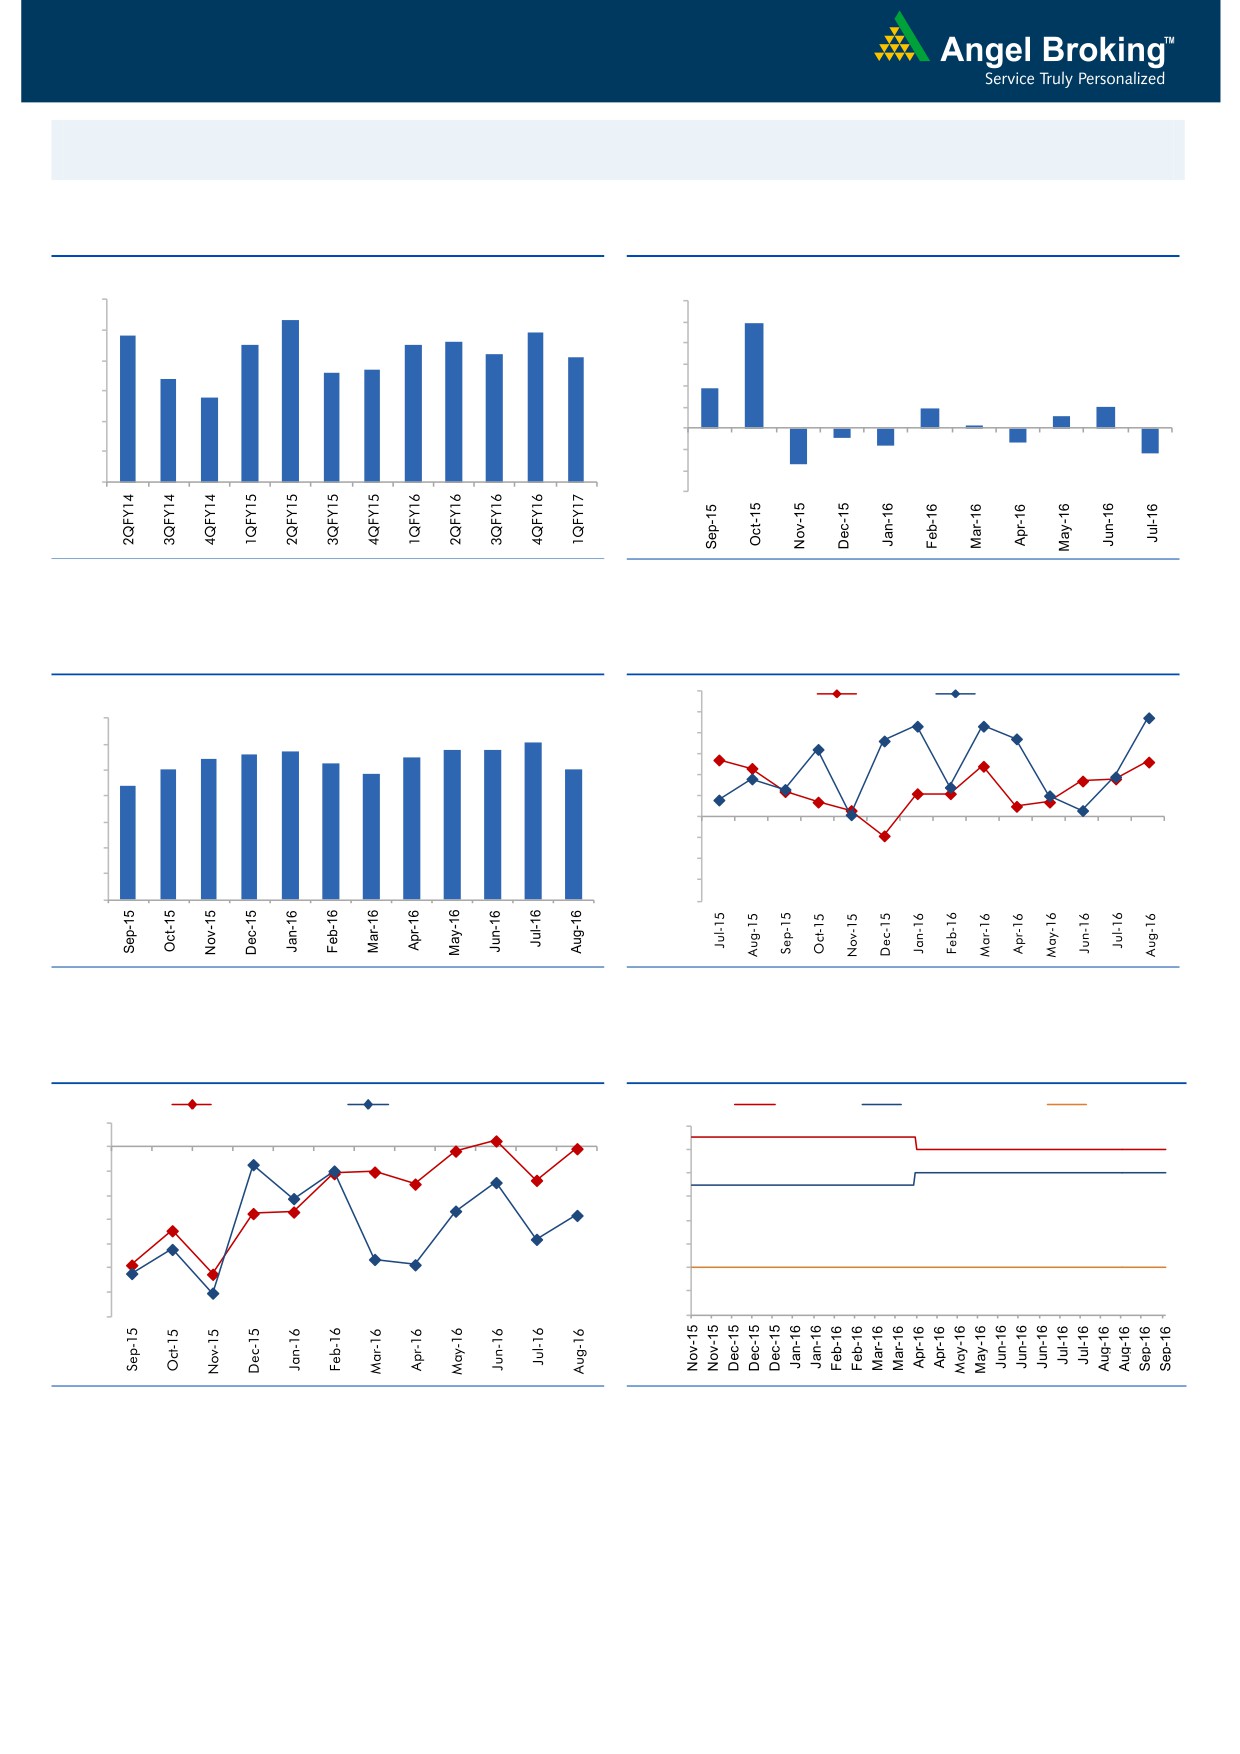
Macro watch
Exhibit 1: Quarterly GDP trends
Exhibit 2: IIP trends
(%)
(%)
9.0
12.0
8.3
9.9
7.8
7.9
8.0
7.5
7.5
7.6
10.0
7.2
7.1
8.0
6.6
6.7
7.0
6.4
6.0
3.7
5.8
6.0
4.0
1.9
2.0
1.1
2.0
0.3
5.0
-
4.0
(2.0)
(0.9)
(1.3)
(1.6)
(4.0)
(2.4)
3.0
(3.4)
(6.0)
Source: CSO, Angel Research
Source: MOSPI, Angel Research
Exhibit 3: Monthly CPI inflation trends
Exhibit 4: Manufacturing and services PMI
56.0
Mfg. PMI
Services PMI
(%)
55.0
7.0
6.1
5.7
5.8
5.8
54.0
6.0
5.4
5.6
5.5
5.0
5.3
5.1
53.0
4.8
5.0
4.4
52.0
4.0
51.0
50.0
3.0
49.0
2.0
48.0
1.0
47.0
-
46.0
Source: MOSPI, Angel Research
Source: Market, Angel Research; Note: Level above 50 indicates expansion
Exhibit 5: Exports and imports growth trends
Exhibit 6: Key policy rates
(%)
Exports yoy growth
Imports yoy growth
(%)
Repo rate
Reverse Repo rate
CRR
5.0
7.00
0.0
6.50
(5.0)
6.00
(10.0)
5.50
(15.0)
5.00
(20.0)
4.50
(25.0)
4.00
(30.0)
3.50
(35.0)
3.00
Source: Bloomberg, Angel Research
Source: RBI, Angel Research
Market Outlook
September 29, 2016
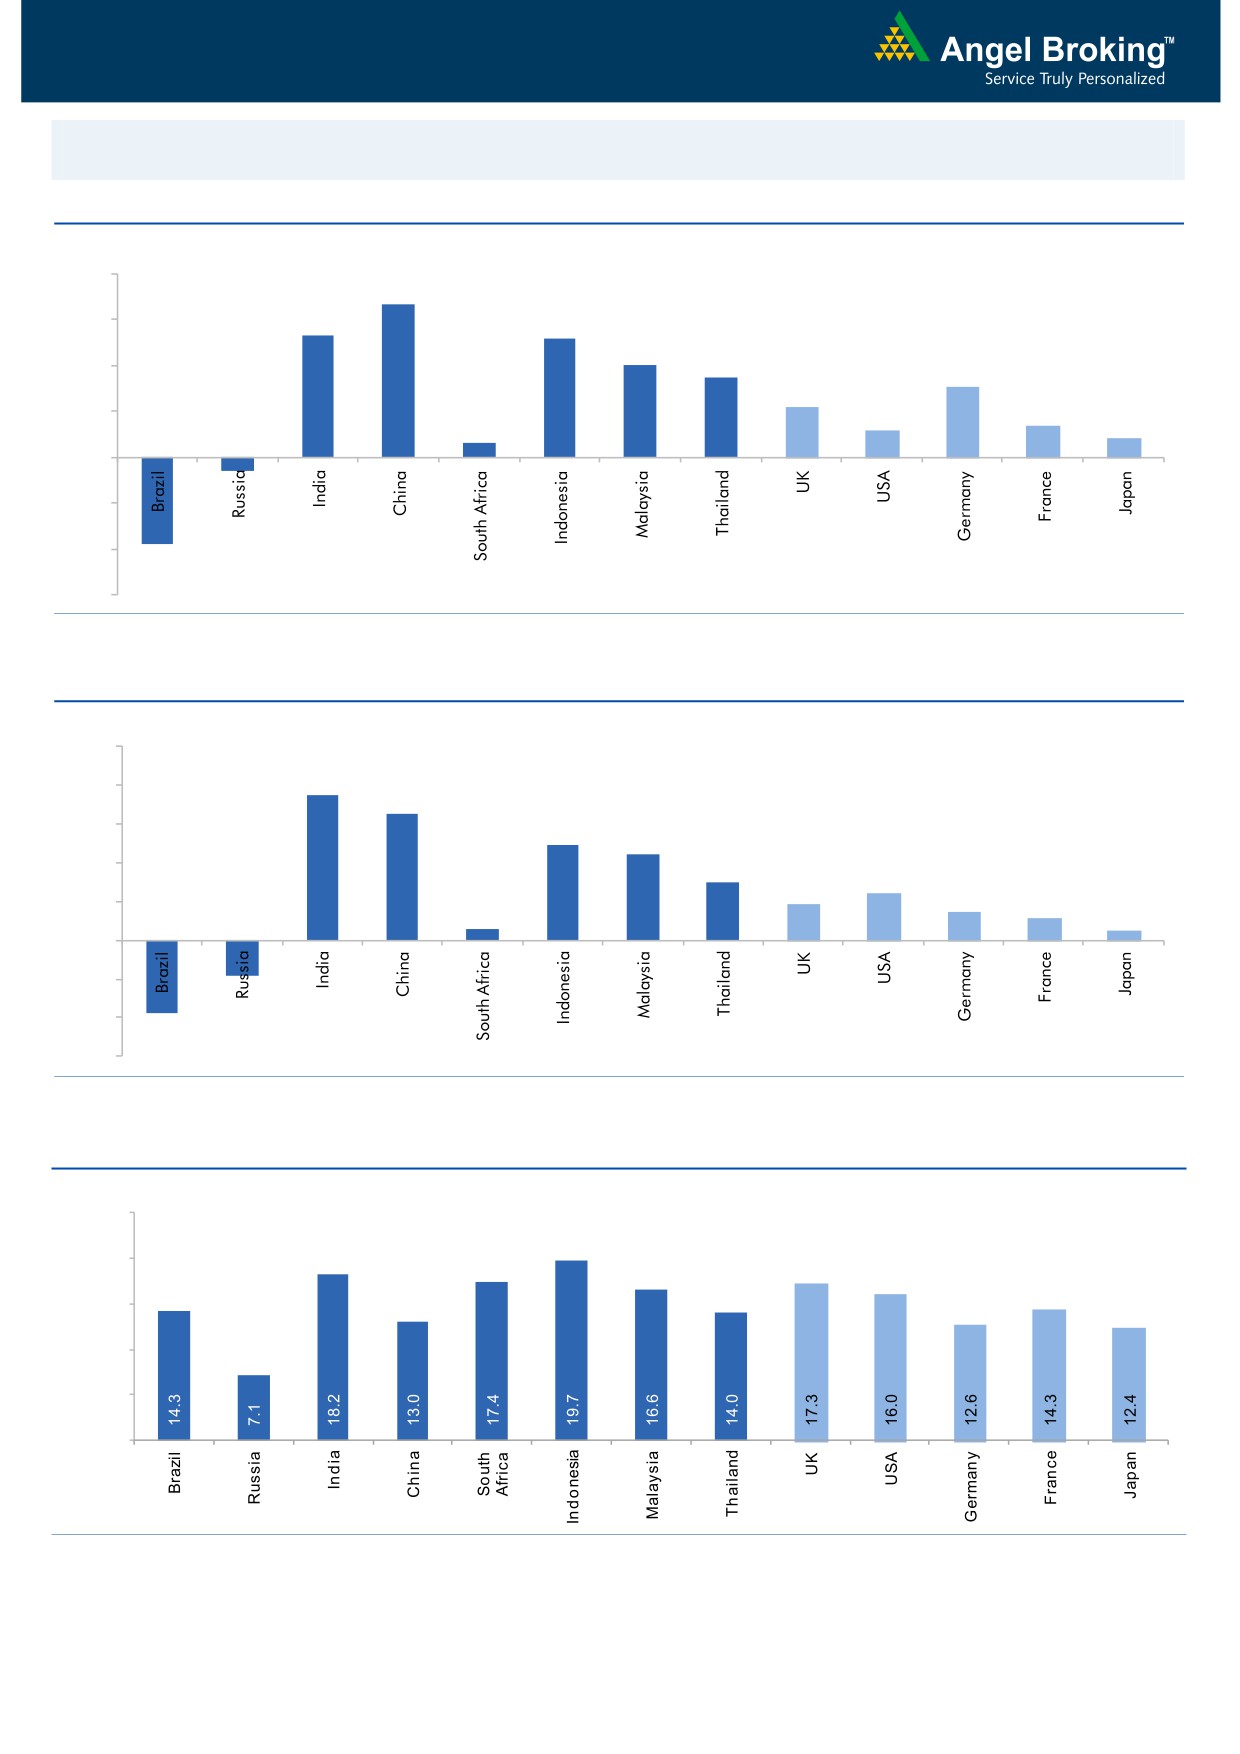
Global watch
Exhibit 1: Latest quarterly GDP Growth (%, yoy) across select developing and developed countries
(%)
8.0
6.7
6.0
5.3
0.6
5.2
4.0
3.5
4.0
3.1
2.2
1.4
2.0
1.2
0.8
-
(2.0)
(0.6)
(4.0)
(3.8)
(6.0)
Source: Bloomberg, Angel Research
Exhibit 2: 2016 GDP Growth projection by IMF (%, yoy) across select developing and developed countries
(%)
10.0
7.5
8.0
6.5
6.0
4.9
4.4
4.0
3.0
2.4
1.9
1.5
2.0
1.1
0.6
0.5
(3.8)
(1.8)
-
(2.0)
(4.0)
(6.0)
Source: IMF, Angel Research
Exhibit 3: One year forward P-E ratio across select developing and developed countries
(x)
25.0
20.0
15.0
10.0
5.0
-
Source: IMF, Angel Research
Market Outlook
September 29, 2016
Exhibit 4: Relative performance of indices across globe
Returns (%)
Country
Name of index
Closing price
1M
3M
1YR
Brazil
Bovespa
59,356
2.8
16.4
30.9
Russia
Micex
1,981
(0.3)
4.7
22.5
India
Nifty
8,745
1.8
8.1
9.6
China
Shanghai Composite
2,988
(2.4)
2.2
(5.1)
South Africa
Top 40
45,234
(3.6)
0.3
2.2
Mexico
Mexbol
48,047
1.4
5.7
12.7
Indonesia
LQ45
940
2.3
13.1
27.6
Malaysia
KLCI
1,665
(1.0)
1.5
(0.3)
Thailand
SET 50
941
(4.2)
5.5
4.1
USA
Dow Jones
18,339
(0.3)
5.3
12.6
UK
FTSE
6,849
0.2
7.7
12.8
Japan
Nikkei
16,684
(0.5)
10.1
(8.7)
Germany
DAX
10,438
(1.0)
7.8
9.3
France
CAC
4,432
0.2
4.6
(5.0)
Source: Bloomberg, Angel Research
Stock Watch
September 29, 2016
Company Name
Reco
CMP
Target
Mkt Cap
Sales ( Čcr )
OPM(%)
EPS (Č)
PER(x)
P/BV(x)
RoE(%)
EV/Sales(x)
(Č)
Price ( Č)
( Č cr )
FY17E FY18E
FY17E
FY18E
FY17E
FY18E
FY17E
FY18E
FY17E
FY18E
FY17E
FY18E
FY17E
FY18E
Agri / Agri Chemical
Rallis
Neutral
224
-
4,350
1,937
2,164
13.3
14.3
9.0
11.0
24.9
20.3
4.3
3.8
18.4
19.8
2.3
2.0
United Phosphorus
Neutral
684
-
34,661
15,176
17,604
18.5
18.5
37.4
44.6
18.3
15.3
3.6
3.0
21.4
21.2
2.4
2.0
Auto & Auto Ancillary
Ashok Leyland
Buy
82
111
23,308
22,407
26,022
10.6
10.6
5.2
6.4
15.7
12.8
3.6
3.0
23.6
24.7
1.1
0.9
Bajaj Auto
Neutral
2,914
-
84,319
25,093
27,891
19.5
19.2
143.9
162.5
20.3
17.9
5.7
4.9
30.3
29.4
3.1
2.7
Bharat Forge
Neutral
944
-
21,975
7,726
8,713
20.5
21.2
35.3
42.7
26.7
22.1
4.9
4.5
18.9
20.1
2.9
2.5
Eicher Motors
Neutral
25,787
-
70,039
16,583
20,447
17.5
18.0
598.0
745.2
43.1
34.6
14.7
11.2
41.2
38.3
4.1
3.2
Gabriel India
Neutral
120
-
1,722
1,544
1,715
9.0
9.3
5.4
6.3
22.2
19.0
4.2
3.7
18.9
19.5
1.1
0.9
Hero Motocorp
Neutral
3,450
-
68,901
31,253
35,198
15.3
15.0
172.3
192.1
20.0
18.0
7.3
6.3
38.9
37.0
2.1
1.8
Jamna Auto Industries Neutral
220
-
1,755
1,486
1,620
9.8
9.9
15.0
17.2
14.7
12.8
3.2
2.7
21.8
21.3
1.2
1.1
L G Balakrishnan & Bros Neutral
562
-
882
1,302
1,432
11.6
11.9
43.7
53.0
12.9
10.6
1.8
1.7
13.8
14.2
0.8
0.7
Mahindra and Mahindra Neutral
1,379
-
85,664
46,534
53,077
11.6
11.7
67.3
78.1
20.5
17.7
3.3
2.9
15.4
15.8
1.8
1.6
Maruti
Neutral
5,521
-
166,769
69,186
82,217
14.7
14.4
198.5
241.4
27.8
22.9
5.4
4.4
20.2
20.0
2.1
1.7
Minda Industries
Neutral
293
-
2,320
2,728
3,042
9.0
9.1
68.2
86.2
4.3
3.4
1.0
0.8
23.8
24.3
0.9
0.8
Motherson Sumi
Neutral
316
-
44,389
45,896
53,687
7.8
8.3
13.0
16.1
24.3
19.6
7.8
6.2
34.7
35.4
1.0
0.9
Rane Brake Lining
Neutral
1,244
-
985
511
562
11.3
11.5
28.1
30.9
44.3
40.3
6.8
6.1
15.3
15.0
2.1
1.9
Setco Automotive
Neutral
43
-
574
741
837
13.0
13.0
15.2
17.0
2.8
2.5
0.5
0.4
15.8
16.3
1.2
1.1
Tata Motors
Neutral
540
-
155,866
300,209
338,549
8.9
8.4
42.7
54.3
12.7
10.0
2.0
1.7
15.6
17.2
0.6
0.5
TVS Motor
Neutral
352
-
16,709
13,390
15,948
6.9
7.1
12.8
16.5
27.6
21.3
6.9
5.4
26.3
27.2
1.3
1.1
Amara Raja Batteries
Accumulate
1,026
1,174
17,533
5,429
6,471
17.5
17.6
35.3
43.5
29.1
23.6
6.7
5.4
25.3
24.8
3.1
2.5
Exide Industries
Neutral
190
-
16,154
7,439
8,307
15.0
15.0
8.1
9.3
23.5
20.4
3.3
2.9
14.3
16.7
1.8
1.6
Apollo Tyres
Neutral
220
-
11,221
12,877
14,504
14.3
13.9
21.4
23.0
10.3
9.6
1.6
1.4
16.4
15.2
1.0
1.0
Ceat
Neutral
1,255
-
5,076
7,524
8,624
13.0
12.7
131.1
144.3
9.6
8.7
1.8
1.5
19.8
18.6
0.8
0.7
JK Tyres
Neutral
148
-
3,367
7,455
8,056
15.0
15.0
21.8
24.5
6.8
6.1
1.4
1.2
22.8
21.3
0.6
0.5
Swaraj Engines
Neutral
1,200
-
1,490
660
810
15.2
16.4
54.5
72.8
22.0
16.5
6.9
6.2
31.5
39.2
2.1
1.7
Subros
Neutral
134
-
801
1,488
1,681
11.7
11.9
6.4
7.2
20.9
18.6
2.2
2.0
10.8
11.4
0.8
0.7
Indag Rubber
Neutral
181
-
475
286
326
19.8
16.8
11.7
13.3
15.5
13.6
2.6
2.4
17.8
17.1
1.3
1.2
Capital Goods
ACE
Neutral
46
-
458
709
814
4.1
4.6
1.4
2.1
33.0
22.0
1.4
1.3
4.4
6.0
0.8
0.7
BEML
Buy
910
1,157
3,791
3,451
4,055
6.3
9.2
31.4
57.9
29.0
15.7
1.7
1.6
6.3
10.9
1.2
1.0
Bharat Electronics
Accumulate
1,281
1,414
30,743
8,137
9,169
16.8
17.2
58.7
62.5
21.8
20.5
3.4
3.0
44.6
46.3
2.8
2.5
Stock Watch
September 29, 2016
Company Name
Reco
CMP
Target
Mkt Cap
Sales ( Čcr )
OPM(%)
EPS (Č)
PER(x)
P/BV(x)
RoE(%)
EV/Sales(x)
(Č)
Price ( Č)
( Č cr )
FY17E
FY18E
FY17E
FY18E
FY17E
FY18E
FY17E
FY18E
FY17E
FY18E
FY17E
FY18E
FY17E
FY18E
Capital Goods
Voltas
Accumulate
381
407
12,617
6,511
7,514
7.9
8.7
12.9
16.3
29.6
23.4
5.3
4.7
16.7
18.5
1.7
1.4
BGR Energy
Neutral
116
-
840
16,567
33,848
6.0
5.6
7.8
5.9
14.9
19.7
0.9
0.8
4.7
4.2
0.2
0.1
BHEL
Neutral
144
-
35,184
28,797
34,742
-
2.8
2.3
6.9
62.5
20.8
1.1
1.0
1.3
4.8
0.9
0.6
Blue Star
Accumulate
549
578
5,232
4,351
5,024
6.4
7.1
17.2
20.6
32.0
26.6
20.8
17.3
23.1
24.1
1.2
1.1
Crompton Greaves
Neutral
80
-
5,005
5,777
6,120
5.9
7.0
3.3
4.5
24.2
17.7
1.1
1.0
4.4
5.9
0.8
0.7
Greaves Cotton
Neutral
131
-
3,206
1,755
1,881
16.8
16.9
7.8
8.5
16.8
15.5
3.4
3.1
20.6
20.9
1.5
1.4
Inox Wind
Buy
206
286
4,565
5,605
6,267
15.7
16.4
24.8
30.0
8.3
6.9
2.3
1.7
25.9
24.4
0.9
0.7
KEC International
Neutral
126
-
3,246
9,294
10,186
7.9
8.1
9.9
11.9
12.8
10.6
1.9
1.6
15.6
16.3
0.6
0.5
Thermax
Neutral
860
-
10,247
5,421
5,940
7.3
7.3
25.7
30.2
33.5
28.5
4.1
3.7
12.2
13.1
1.8
1.6
VATech Wabag
Buy
566
681
3,085
3,136
3,845
8.9
9.1
26.0
35.9
21.8
15.8
2.7
2.3
13.4
15.9
0.9
0.7
Cement
ACC
Neutral
1,617
-
30,360
11,225
13,172
13.2
16.9
44.5
75.5
36.3
21.4
3.4
3.2
11.2
14.2
2.7
2.3
Ambuja Cements
Neutral
261
-
51,726
9,350
10,979
18.2
22.5
5.8
9.5
44.9
27.4
3.8
3.4
10.2
12.5
5.5
4.7
India Cements
Neutral
150
-
4,602
4,364
4,997
18.5
19.2
7.9
11.3
19.0
13.3
1.4
1.3
8.0
8.5
1.8
1.6
JK Cement
Neutral
853
-
5,967
4,398
5,173
15.5
17.5
31.2
55.5
27.4
15.4
3.3
2.8
12.0
15.5
1.9
1.6
J K Lakshmi Cement
Neutral
498
-
5,856
2,913
3,412
14.5
19.5
7.5
22.5
66.4
22.1
4.1
3.4
12.5
18.0
2.6
2.2
Orient Cement
Neutral
211
-
4,316
2,114
2,558
18.5
20.5
8.1
11.3
26.0
18.6
3.8
3.2
9.0
14.0
2.7
2.1
UltraTech Cement
Neutral
3,971
-
108,967
25,768
30,385
21.0
23.5
111.0
160.0
35.8
24.8
4.6
4.0
13.5
15.8
4.3
3.6
Construction
ITNL
Neutral
103
-
3,385
8,946
10,017
31.0
31.6
8.1
9.1
12.7
11.3
0.5
0.5
4.2
5.0
3.7
3.4
KNR Constructions
Neutral
767
-
2,156
1,385
1,673
14.7
14.0
41.2
48.5
18.6
15.8
3.5
3.0
14.9
15.2
1.6
1.4
Larsen & Toubro
Buy
1,455
1,700
135,635
67,665
77,249
10.7
11.5
57.3
71.2
25.4
20.4
2.3
2.2
12.6
14.3
2.2
1.9
Gujarat Pipavav Port
Neutral
176
-
8,523
705
788
52.2
51.7
5.0
5.6
35.3
31.5
3.5
3.1
11.2
11.2
11.7
10.0
Nagarjuna Const.
Neutral
86
-
4,775
8,842
9,775
9.1
8.8
5.3
6.4
16.2
13.4
1.3
1.2
8.2
9.1
0.7
0.6
PNC Infratech
Buy
121
143
3,096
2,350
2,904
13.1
13.2
9.0
8.8
13.4
13.7
0.5
0.4
15.9
13.9
1.4
1.2
Simplex Infra
Neutral
336
-
1,662
6,829
7,954
10.5
10.5
31.4
37.4
10.7
9.0
1.1
1.0
9.9
13.4
0.7
0.6
Power Mech Projects
Neutral
490
-
721
1,801
2,219
12.7
14.6
72.1
113.9
6.8
4.3
1.3
1.1
16.8
11.9
0.4
0.3
Sadbhav Engineering
Neutral
284
-
4,872
3,598
4,140
10.3
10.6
9.0
11.9
31.6
23.9
3.3
2.9
9.9
11.9
1.6
1.4
NBCC
Neutral
258
-
15,489
7,428
9,549
7.9
8.6
8.2
11.0
31.5
23.5
1.6
1.2
28.2
28.7
1.8
1.3
MEP Infra
Neutral
44
-
711
1,877
1,943
30.6
29.8
3.0
4.2
14.6
10.4
7.1
4.8
0.6
0.6
1.8
1.6
SIPL
Neutral
108
-
3,811
1,036
1,252
65.5
66.2
(8.4)
(5.6)
4.1
4.6
(22.8)
(15.9)
11.9
9.9
Stock Watch
September 29, 2016
Company Name
Reco
CMP
Target
Mkt Cap
Sales ( Čcr )
OPM(%)
EPS (Č)
PER(x)
P/BV(x)
RoE(%)
EV/Sales(x)
(Č)
Price ( Č)
( Č cr )
FY17E
FY18E
FY17E
FY18E
FY17E
FY18E
FY17E
FY18E
FY17E
FY18E
FY17E
FY18E
FY17E
FY18E
Construction
Engineers India
Neutral
257
-
8,647
1,725
1,935
16.0
19.1
11.4
13.9
22.5
18.5
3.1
3.0
13.4
15.3
3.9
3.5
Financials
Axis Bank
Neutral
549
-
131,069
58,081
66,459
3.5
3.5
32.4
44.6
17.0
12.3
2.2
1.9
13.6
16.5
-
-
Bank of Baroda
Neutral
169
-
38,825
19,980
23,178
1.8
1.8
11.5
17.3
14.7
9.7
1.7
1.4
8.3
10.1
-
-
Canara Bank
Neutral
313
-
16,968
15,225
16,836
1.8
1.8
14.5
28.0
21.6
11.2
1.5
1.2
5.8
8.5
-
-
Dewan Housing Finance Accumulate
298
325
8,704
2,225
2,688
2.9
2.9
29.7
34.6
10.0
8.6
1.6
1.4
16.1
16.8
-
-
Equitas Holdings
Buy
177
235
5,950
939
1,281
11.7
11.5
5.8
8.2
30.6
21.6
2.6
2.4
10.9
11.5
-
-
Federal Bank
Neutral
76
-
12,972
9,353
10,623
2.9
2.9
4.4
5.8
17.2
13.0
1.6
1.5
9.5
11.0
-
-
HDFC
Neutral
1,423
-
224,963
11,475
13,450
3.4
3.4
45.3
52.5
31.4
27.1
6.1
5.4
20.2
20.5
-
-
HDFC Bank
Neutral
1,295
-
327,860
46,097
55,433
4.5
4.5
58.4
68.0
22.2
19.0
3.9
3.3
18.8
18.6
-
-
ICICI Bank
Neutral
261
-
151,705
39,029
45,903
3.3
3.3
16.7
16.3
15.6
16.0
1.9
1.8
10.1
12.4
-
-
LIC Housing Finance
Neutral
588
-
29,677
3,712
4,293
2.6
2.5
39.0
46.0
15.1
12.8
2.8
2.4
19.9
20.1
-
-
Punjab Natl.Bank
Neutral
146
-
31,164
23,532
23,595
2.3
2.4
6.8
12.6
21.5
11.6
3.3
2.4
3.3
6.5
-
-
RBL Bank
Accumulate
298
325
11,004
1,783
2,309
2.6
2.6
12.7
16.4
23.4
18.1
2.6
2.3
12.8
13.3
-
-
South Ind.Bank
Neutral
23
-
3,072
6,435
7,578
2.5
2.5
2.7
3.1
8.4
7.3
1.1
0.9
10.1
11.2
-
-
St Bk of India
Neutral
254
-
196,786
88,650
98,335
2.6
2.6
13.5
18.8
18.8
13.5
1.8
1.6
7.0
8.5
-
-
Union Bank
Neutral
146
-
10,009
13,450
14,925
2.3
2.3
25.5
34.5
5.7
4.2
0.8
0.7
7.5
10.2
-
-
Yes Bank
Neutral
1,269
-
53,404
8,978
11,281
3.3
3.4
74.0
90.0
17.1
14.1
3.3
2.8
17.0
17.2
-
-
FMCG
Asian Paints
Neutral
1,194
-
114,543
17,128
18,978
16.8
16.4
19.1
20.7
62.5
57.7
21.8
20.5
34.8
35.5
6.6
6.0
Britannia
Neutral
3,412
-
40,938
9,795
11,040
14.6
14.9
80.3
94.0
42.5
36.3
17.5
13.5
41.2
-
4.0
3.5
Colgate
Neutral
975
-
26,531
4,605
5,149
23.4
23.4
23.8
26.9
41.0
36.3
22.7
17.7
64.8
66.8
5.7
5.1
Dabur India
Neutral
277
-
48,799
8,315
9,405
19.8
20.7
8.1
9.2
34.3
30.2
9.5
7.9
31.6
31.0
5.5
4.9
GlaxoSmith Con*
Neutral
6,085
-
25,590
4,350
4,823
21.2
21.4
179.2
196.5
34.0
31.0
9.0
7.6
27.1
26.8
5.3
4.7
Godrej Consumer
Neutral
1,600
-
54,482
10,235
11,428
18.4
18.6
41.1
44.2
38.9
36.2
8.6
7.3
24.9
24.8
5.4
4.8
HUL
Neutral
887
-
192,012
35,252
38,495
17.6
17.4
20.4
21.9
43.4
40.5
35.7
31.3
82.2
77.3
5.3
4.8
ITC
Accumulate
247
283
298,209
40,059
44,439
39.0
39.2
9.1
10.1
27.2
24.5
7.4
6.5
27.2
26.5
6.9
6.2
Marico
Neutral
284
-
36,699
6,430
7,349
18.8
19.5
6.4
7.7
44.5
36.9
13.4
11.3
33.2
32.5
5.5
4.8
Nestle*
Neutral
6,450
-
62,191
10,073
11,807
20.7
21.5
124.8
154.2
51.7
41.8
21.2
19.1
34.8
36.7
6.0
5.1
Tata Global
Neutral
147
-
9,262
8,675
9,088
9.8
9.8
7.4
8.2
19.8
17.9
2.3
2.2
7.9
8.1
1.0
0.9
Procter & Gamble
Accumulate
6,851
7,369
22,238
2,939
3,342
23.2
23.0
146.2
163.7
46.9
41.9
104.9
100.6
25.3
23.5
7.1
6.2
Hygiene
Stock Watch
September 29, 2016
Company Name
Reco
CMP
Target
Mkt Cap
Sales ( Čcr )
OPM(%)
EPS (Č)
PER(x)
P/BV(x)
RoE(%)
EV/Sales(x)
(Č)
Price ( Č)
( Č cr )
FY17E FY18E
FY17E
FY18E
FY17E
FY18E
FY17E
FY18E
FY17E
FY18E
FY17E
FY18E
FY17E
FY18E
IT
HCL Tech^
Buy
796
1,000
112,233
49,242
57,168
20.5
20.5
55.7
64.1
14.3
12.4
2.9
2.2
20.3
17.9
2.1
1.7
Infosys
Buy
1,039
1,370
238,561
69,934
79,025
27.5
27.5
64.8
72.0
16.0
14.4
3.5
3.2
22.0
22.3
2.9
2.5
TCS
Buy
2,423
3,004
477,523
121,684
136,286
27.3
27.3
135.0
150.1
18.0
16.2
6.0
5.5
33.2
33.9
3.7
3.2
Tech Mahindra
Buy
441
700
42,764
30,347
33,685
17.0
17.0
37.5
41.3
11.8
10.7
2.6
2.2
21.8
20.7
1.1
1.0
Wipro
Buy
483
680
117,501
51,631
55,822
21.7
17.9
35.9
36.9
13.5
13.1
2.8
2.6
19.0
18.1
2.0
1.8
Media
D B Corp
Neutral
399
-
7,339
2,297
2,590
27.4
28.2
21.0
23.4
19.0
17.1
4.4
3.8
23.7
23.1
3.0
2.6
HT Media
Neutral
82
-
1,917
2,693
2,991
12.6
12.9
7.9
9.0
10.4
9.2
0.9
0.8
7.8
8.3
0.3
0.2
Jagran Prakashan
Buy
190
225
6,218
2,355
2,635
28.0
28.0
10.8
12.5
17.6
15.2
3.8
3.3
21.7
21.7
2.7
2.3
Sun TV Network
Neutral
503
-
19,832
2,850
3,265
70.1
71.0
26.2
30.4
19.2
16.6
4.9
4.3
24.3
25.6
6.6
5.6
Hindustan Media
Neutral
287
-
2,106
1,016
1,138
24.3
25.2
27.3
30.1
10.5
9.5
2.0
1.8
16.2
15.8
1.4
1.2
Ventures
TV Today Network
Buy
302
363
1,804
637
743
27.5
27.5
18.4
21.4
16.5
14.2
2.9
2.4
17.4
17.2
2.4
2.0
Metals & Mining
Coal India
Neutral
329
-
207,619
84,638
94,297
21.4
22.3
24.5
27.1
13.4
12.1
5.6
5.3
42.6
46.0
2.0
1.8
Hind. Zinc
Neutral
230
-
97,225
14,252
18,465
55.9
48.3
15.8
21.5
14.6
10.7
2.4
2.1
17.0
20.7
6.8
5.3
Hindalco
Neutral
156
-
32,234
107,899
112,095
7.4
8.2
9.2
13.0
17.0
12.0
0.8
0.8
4.8
6.6
0.8
0.8
JSW Steel
Neutral
1,775
-
42,915
53,201
58,779
16.1
16.2
130.6
153.7
13.6
11.6
1.8
1.6
14.0
14.4
1.6
1.4
NMDC
Neutral
110
-
43,552
6,643
7,284
44.4
47.7
7.1
7.7
15.5
14.3
1.3
1.3
8.8
9.2
4.3
3.9
SAIL
Neutral
49
-
20,134
47,528
53,738
(0.7)
2.1
(1.9)
2.6
18.8
0.5
0.5
(1.6)
3.9
1.3
1.2
Vedanta
Neutral
175
-
51,823
71,744
81,944
19.2
21.7
13.4
20.1
13.0
8.7
1.1
1.0
8.4
11.3
1.1
0.8
Tata Steel
Neutral
380
-
36,887
121,374
121,856
7.2
8.4
18.6
34.3
20.4
11.1
1.3
1.2
6.1
10.1
0.9
0.9
Oil & Gas
Cairn India
Neutral
201
-
37,732
9,127
10,632
4.3
20.6
8.8
11.7
22.9
17.2
0.7
0.7
3.3
4.2
5.6
4.6
GAIL
Neutral
375
-
47,555
56,220
65,198
9.3
10.1
27.1
33.3
13.8
11.3
1.3
1.2
9.3
10.7
1.0
0.9
ONGC
Neutral
252
-
215,256
137,222
152,563
15.0
21.8
19.5
24.1
12.9
10.4
1.1
1.0
8.5
10.1
1.9
1.7
Indian Oil Corp
Neutral
592
-
143,674
373,359
428,656
5.9
5.5
54.0
59.3
11.0
10.0
1.7
1.5
16.0
15.6
0.5
0.5
Reliance Industries
Neutral
1,090
-
353,329
301,963
358,039
12.1
12.6
87.7
101.7
12.4
10.7
1.3
1.2
10.7
11.3
1.6
1.4
Pharmaceuticals
Alembic Pharma
Neutral
674
-
12,699
3,483
4,083
20.2
21.4
24.3
30.4
27.7
22.2
6.3
5.0
25.5
25.3
3.6
3.0
Aurobindo Pharma
Neutral
868
-
50,807
15,720
18,078
23.7
23.7
41.4
47.3
21.0
18.4
5.5
4.3
29.6
26.1
3.5
3.0
Sanofi India*
Neutral
4,230
-
9,742
2,357
2,692
17.3
17.3
153.5
169.2
27.6
25.0
4.7
3.8
25.8
28.4
3.8
3.1
Cadila Healthcare
Neutral
398
-
40,771
11,126
13,148
22.0
22.0
17.1
20.0
23.3
19.9
6.0
4.8
28.8
26.6
3.7
3.0
Cipla
Sell
605
490
48,640
15,378
18,089
17.4
18.4
21.6
27.2
28.0
22.3
3.6
3.2
13.7
15.2
3.4
2.8
Stock Watch
September 29, 2016
Company Name
Reco
CMP
Target
Mkt Cap
Sales ( Čcr )
OPM(%)
EPS (Č)
PER(x)
P/BV(x)
RoE(%)
EV/Sales(x)
(Č)
Price ( Č)
( Č cr )
FY17E FY18E
FY17E
FY18E
FY17E
FY18E
FY17E
FY18E
FY17E
FY18E
FY17E
FY18E
FY17E
FY18E
Pharmaceuticals
Dr Reddy's
Neutral
3,205
-
53,104
16,043
18,119
23.1
24.7
126.0
157.8
25.4
20.3
3.8
3.2
15.7
17.1
3.3
2.9
Dishman Pharma
Sell
238
45
3,841
1,718
1,890
22.7
22.8
9.5
11.3
25.1
21.1
2.4
2.2
10.1
10.9
2.7
2.4
GSK Pharma*
Neutral
2,830
-
23,970
3,528
3,811
16.6
18.8
51.8
59.4
54.6
47.6
14.6
14.6
26.3
30.6
6.6
6.1
Indoco Remedies
Sell
331
225
3,047
1,112
1,289
18.2
18.2
13.2
15.6
25.1
21.2
4.5
3.8
19.2
19.2
2.9
2.5
Ipca labs
Neutral
610
-
7,695
3,303
3,799
15.3
15.3
17.3
19.7
35.3
31.0
3.1
2.8
9.1
9.4
2.5
2.1
Lupin
Buy
1,517
1,809
68,372
15,912
18,644
26.4
26.7
58.1
69.3
26.1
21.9
5.1
4.2
21.4
20.9
4.4
3.6
Sun Pharma
Buy
766
944
184,461
31,129
35,258
30.0
30.9
28.0
32.8
27.4
23.4
4.2
3.5
18.7
18.9
5.5
4.7
Power
Tata Power
Neutral
76
-
20,582
36,916
39,557
17.4
27.1
5.1
6.3
14.9
12.1
1.3
1.2
9.0
10.3
1.6
1.4
NTPC
Neutral
153
-
125,826
86,605
95,545
17.5
20.8
11.8
13.4
12.9
11.4
1.3
1.2
10.5
11.1
2.8
2.8
Power Grid
Neutral
178
-
93,279
25,763
29,762
74.3
73.1
14.8
17.3
12.1
10.3
1.9
1.7
16.9
17.5
7.9
7.5
Real Estate
MLIFE
Buy
447
522
1,835
1,152
1,300
22.7
24.6
29.9
35.8
15.0
12.5
1.1
1.0
7.6
8.6
2.3
1.9
Telecom
Bharti Airtel
Neutral
322
-
128,896
105,086
114,808
34.5
34.7
12.2
16.4
26.4
19.7
1.8
1.7
6.8
8.4
2.1
1.9
Idea Cellular
Neutral
83
-
29,707
40,133
43,731
37.2
37.1
6.4
6.5
12.9
12.7
1.1
1.0
8.2
7.6
1.8
1.5
zOthers
Abbott India
Neutral
4,721
-
10,031
3,153
3,583
14.1
14.4
152.2
182.7
31.0
25.8
152.3
130.0
25.6
26.1
2.9
2.5
Bajaj Electricals
Buy
264
306
2,667
5,099
5,805
5.6
5.9
11.4
14.6
23.2
18.1
3.1
2.8
13.4
15.1
0.5
0.5
Finolex Cables
Neutral
439
-
6,709
2,883
3,115
12.0
12.1
14.2
18.6
30.9
23.6
16.4
14.4
15.8
14.6
2.0
1.8
Goodyear India*
Neutral
659
-
1,519
1,598
1,704
10.4
10.2
49.4
52.6
13.3
12.5
61.6
54.0
18.2
17.0
0.6
87.1
Hitachi
Neutral
1,604
-
4,362
2,081
2,433
8.8
8.9
33.4
39.9
48.0
40.2
38.8
32.3
22.1
21.4
2.1
1.8
Jyothy Laboratories
Neutral
345
-
6,244
1,440
2,052
11.5
13.0
8.5
10.0
40.6
34.5
9.8
9.1
18.6
19.3
4.6
3.2
Page Industries
Neutral
15,334
-
17,103
2,450
3,124
20.1
17.6
299.0
310.0
51.3
49.5
341.5
260.7
47.1
87.5
7.0
5.5
Relaxo Footwears
Neutral
461
-
5,530
2,085
2,469
9.2
8.2
7.6
8.0
60.9
58.0
23.6
20.2
17.9
18.8
2.7
2.3
Siyaram Silk Mills
Accumulate
1,300
1,469
1,219
1,799
2,040
11.6
11.7
104.9
122.4
12.4
10.6
2.0
1.7
16.4
16.4
0.9
0.8
Styrolution ABS India*
Neutral
595
-
1,046
1,440
1,537
9.2
9.0
40.6
42.6
14.7
14.0
37.4
34.0
12.3
11.6
0.7
0.6
TVS Srichakra
Neutral
3,744
-
2,867
2,304
2,614
13.7
13.8
231.1
266.6
16.2
14.0
420.7
331.3
33.9
29.3
1.2
1.1
HSIL
Neutral
339
-
2,454
2,384
2,515
15.8
16.3
15.3
19.4
22.2
17.5
22.0
19.0
7.8
9.3
1.2
1.1
Kirloskar Engines India
Neutral
328
-
4,736
2,554
2,800
9.9
10.0
10.5
12.1
31.2
27.1
13.1
12.3
10.7
11.7
1.5
1.3
Ltd
M M Forgings
Neutral
419
-
506
546
608
20.4
20.7
41.3
48.7
10.2
8.6
57.4
50.8
16.6
17.0
0.8
0.7
Banco Products (India)
Neutral
216
-
1,545
1,353
1,471
12.3
12.4
14.5
16.3
14.9
13.3
20.6
18.5
14.5
14.6
1.1
116.2
Competent Automobiles Neutral
196
-
120
1,137
1,256
3.1
2.7
28.0
23.6
7.0
8.3
37.6
34.0
14.3
11.5
0.1
0.1
Stock Watch
September 29, 2016
Company Name
Reco
CMP
Target
Mkt Cap
Sales ( Čcr )
OPM(%)
EPS (Č)
PER(x)
P/BV(x)
RoE(%)
EV/Sales(x)
(Č)
Price ( Č)
( Č cr )
FY17E
FY18E
FY17E
FY18E
FY17E
FY18E
FY17E
FY18E
FY17E
FY18E
FY17E
FY18E
FY17E
FY18E
zOthers
Nilkamal
Neutral
1,325
-
1,978
1,995
2,165
10.7
10.4
69.8
80.6
19.0
16.4
75.7
65.8
16.6
16.5
1.0
0.9
Visaka Industries
Neutral
198
-
314
1,051
1,138
10.3
10.4
21.0
23.1
9.4
8.5
25.3
23.7
9.0
9.2
0.6
0.5
Transport Corporation of
Neutral
191
-
1,465
2,671
2,911
8.5
8.8
13.9
15.7
13.8
12.2
1.9
1.7
13.7
13.8
0.7
0.6
India
Elecon Engineering
Neutral
61
-
661
1,482
1,660
13.7
14.5
3.9
5.8
15.6
10.5
3.7
3.4
7.8
10.9
0.8
0.7
Surya Roshni
Neutral
234
-
1,027
3,342
3,625
7.8
7.5
17.3
19.8
13.6
11.9
25.7
20.7
10.5
10.8
0.6
0.5
MT Educare
Neutral
134
-
534
366
417
17.7
18.2
9.4
10.8
14.3
12.4
3.2
2.8
22.2
22.3
1.4
1.2
Radico Khaitan
Neutral
126
-
1,673
1,659
1,802
13.0
13.2
6.3
7.4
19.9
17.1
1.7
1.6
8.6
9.3
1.4
1.3
Garware Wall Ropes
Neutral
522
-
1,143
873
938
12.9
13.1
30.9
34.9
16.9
15.0
2.7
2.3
15.7
15.2
1.2
1.1
Wonderla Holidays
Neutral
385
-
2,177
287
355
38.0
40.0
11.3
14.2
34.1
27.1
4.9
4.3
21.4
23.9
7.3
5.9
Linc Pen & Plastics
Neutral
270
-
399
382
420
9.3
9.5
13.5
15.7
20.0
17.2
3.4
3.0
17.1
17.3
1.1
1.0
The Byke Hospitality
Neutral
193
-
775
287
384
20.5
20.5
7.6
10.7
25.5
18.1
5.3
4.3
20.7
23.5
2.7
2.0
Interglobe Aviation
Neutral
921
-
33,185
21,122
26,005
14.5
27.6
110.7
132.1
8.3
7.0
49.8
35.6
168.5
201.1
1.5
1.2
Coffee Day Enterprises
Neutral
225
-
4,635
2,964
3,260
20.5
21.2
4.7
8.0
-
28.1
2.6
2.4
5.5
8.5
2.0
1.8
Ltd
Navneet Education
Neutral
101
-
2,399
1,062
1,147
24.0
24.0
6.1
6.6
16.5
15.2
3.4
3.0
20.6
19.8
2.3
2.2
Navkar Corporation
Buy
189
265
2,692
408
612
42.9
42.3
6.8
11.5
27.9
16.4
1.9
1.7
6.9
10.5
7.5
5.0
UFO Moviez
Neutral
485
-
1,339
619
685
33.2
33.4
30.0
34.9
16.2
13.9
2.2
1.9
13.8
13.9
1.9
1.5
VRL Logistics
Neutral
306
-
2,793
1,902
2,119
16.7
16.6
14.6
16.8
21.0
18.2
4.6
4.0
21.9
22.2
1.6
1.4
Team Lease Serv.
Neutral
1,075
-
1,838
3,229
4,001
1.5
1.8
22.8
32.8
47.2
32.7
5.1
4.4
10.7
13.4
0.5
0.4
S H Kelkar & Co.
Neutral
308
-
4,452
1,036
1,160
15.1
15.0
6.1
7.2
50.4
42.9
5.4
4.9
10.7
11.5
4.2
3.7
Quick Heal
Neutral
230
-
1,609
408
495
27.3
27.0
7.7
8.8
29.7
26.1
2.8
2.8
9.3
10.6
3.1
2.6
Narayana Hrudaya
Neutral
336
-
6,868
1,873
2,166
11.5
11.7
2.6
4.0
127.1
84.8
7.8
7.0
6.1
8.3
3.8
3.2
Manpasand Bever.
Neutral
759
-
3,800
836
1,087
19.6
19.4
16.9
23.8
44.9
31.9
5.4
4.7
12.0
14.8
4.3
3.2
Parag Milk Foods
Neutral
304
-
2,554
1,919
2,231
9.3
9.6
9.5
12.9
32.1
23.5
5.0
4.1
15.5
17.5
1.5
1.3
Mirza International
Buy
93
113
1,116
1,024
1,148
18.0
18.0
6.9
8.0
13.4
11.6
2.3
1.9
16.6
16.2
1.3
1.1
Source: Company, Angel Research; Note: *December year end; #September year end; &October year end; Price as on September 28, 2016
Market Outlook
September 29, 2016
Research Team Tel: 022 - 39357800
DISCLAIMER
Angel Broking Private Limited (hereinafter referred to as “Angel”) is a registered Member of National Stock Exchange of India
Limited,Bombay Stock Exchange Limited and Metropolitan Stock Exchange Limited. It is also registered as a Depository Participant with
CDSL and Portfolio Manager with SEBI. It also has registration with AMFI as a Mutual Fund Distributor. Angel Broking Private Limited is a
registered entity with SEBI for Research Analyst in terms of SEBI (Research Analyst) Regulations, 2014 vide registration number
INH000000164. Angel or its associates has not been debarred/ suspended by SEBI or any other regulatory authority for accessing
/dealing in securities Market. Angel or its associates/analyst has not received any compensation / managed or
co-managed public offering of securities of the company covered by Analyst during the past twelve months.
This document is solely for the personal information of the recipient, and must not be singularly used as the basis of any investment
decision. Nothing in this document should be construed as investment or financial advice. Each recipient of this document should make
such investigations as they deem necessary to arrive at an independent evaluation of an investment in the securities of the companies
referred to in this document (including the merits and risks involved), and should consult their own advisors to determine the merits and
risks of such an investment.
Reports based on technical and derivative analysis center on studying charts of a stock's price movement, outstanding positions and
trading volume, as opposed to focusing on a company's fundamentals and, as such, may not match with a report on a company's
fundamentals. Investors are advised to refer the Fundamental and Technical Research Reports available on our website to evaluate the
contrary view, if any.
The information in this document has been printed on the basis of publicly available information, internal data and other reliable
sources believed to be true, but we do not represent that it is accurate or complete and it should not be relied on as such, as this
document is for general guidance only. Angel Broking Pvt. Limited or any of its affiliates/ group companies shall not be in any way
responsible for any loss or damage that may arise to any person from any inadvertent error in the information contained in this report.
Angel Broking Pvt. Limited has not independently verified all the information contained within this document. Accordingly, we cannot
testify, nor make any representation or warranty, express or implied, to the accuracy, contents or data contained within this document.
While Angel Broking Pvt. Limited endeavors to update on a reasonable basis the information discussed in this material, there may be
regulatory, compliance, or other reasons that prevent us from doing so.
This document is being supplied to you solely for your information, and its contents, information or data may not be reproduced,
redistributed or passed on, directly or indirectly.
Neither Angel Broking Pvt. Limited, nor its directors, employees or affiliates shall be liable for any loss or damage that may arise from
or in connection with the use of this information.